Go for an Android debugging tool and ensure that your android app is bug free.
Explore tools now
.svg)


See how thousands of Engineering, Product and Marketing Teams are accelerating their growth with Zipy.

.webp)
Android Debugging, an essential aspect of Android application development. As budding developers and tech enthusiasts, you’re about to embark on a journey into the intricate world of troubleshooting and perfecting Android apps. Debugging is not just a skill, but an art that combines analytical thinking, technical knowledge, and attention to detail. It plays a pivotal role in the app development lifecycle, ensuring that the final product is robust, user-friendly, and free from defects.
In today’s discussion, we’ll delve into the nuances of Android debugging, exploring its definition, methodologies, and common issues encountered in this domain. We’ll understand why debugging is crucial for delivering a great customer experience and app stability, which are the cornerstones of successful Android applications.
We’ll also examine the various methods and tools available for debugging, such as Logcat, Breakpoints, ADB, DDMS, Android Profiler, testing strategies, code reviews, and monitoring tools. These methods are not just theoretical concepts but practical tools that will empower you to identify and resolve issues effectively.
Moreover, we’ll discuss the most common errors in Android development using Java, Kotlin, Flutter, React Native, and SQLite. Understanding these errors is vital for preventing and resolving potential issues in your development process. We will also touch upon security errors, which are becoming increasingly important in today’s digital landscape.
So, let’s gear up to dive deep into the world of Android debugging, enhance our understanding, and sharpen our problem-solving skills in the realm of Android application development.
Android debugging is the process of finding and troubleshooting problems within any android application. There are various techniques and tools to help locate and fix problems in the applications. These issues could occur because of application crashes, logic problems, broken UI or unexpected behavior. Debugging can happen locally while building the app, within the coding environments or during QA when bugs are reported or in live environment issues where customers report problems. Android debugging usually requires debugging tools, setting breakpoints, logging or using some monitoring tool. Great customer experience and app stability both contribute to the success of Android applications. To ensure the same, having good android debugging capabilities and tools is a must for all Android developers.
The most common methods to debug the Android application are as follows:
Example : Here is an example of how to implement these log levels in your Android application.

Java/Kotlin, Flutter and React Native are the most commonly used Android development languages or frameworks for Android application development. SQLite is the most common DB in Android. To understand code related issues in Android one needs to be familiar with the above languages and frameworks. One also needs to have a good understanding of the Android development environment and tools that are provided. To be able to gain expertise in Production level debugging, one needs to start using good monitoring and debugging tools.
Let us start by listing down some of the most common errors developers come across in the popular languages and frameworks.
Remember that error prevention, proper handling, and security practices are essential in all development environments to mitigate these and other potential issues.
Here are some real world examples of commonly occurring errors and how to fix them in Java/Kotlin.
Error Example (Java):
Debugging & Fix (Java):
Error Example (Kotlin):
Debugging & Fix (Kotlin):
Error Example (Java):
Debugging & Fix (Java):
Error Example (Kotlin):
Debugging & Fix (Kotlin):
Error Example (Java/Kotlin):
Debugging & Fix (Java/Kotlin):
Error Example (Java):
Debugging & Fix (Java):
Error Example (Kotlin):
Debugging & Fix (Kotlin):
Error Example (Java/Kotlin):
This error typically occurs when a class that was available during compilation is missing during runtime. Debugging and fixing may involve ensuring that the required class or library is included in your project.
These examples demonstrate debugging and potential fixes for the errors mentioned. The exact debugging process and fix will depend on the context of your code and the specific error you encounter.
Error Example:
Fix:
Implement the missing functionality or method to resolve the error.
Error Example:
Fix:
Ensure that you have proper error handling in place for platform-specific features. Check if the error message provides information about the specific issue and take appropriate actions to handle it.
Error Example:
dart
Fix:
Review the assertion and the condition. Ensure that the condition is met, or update the assertion to reflect the expected condition.
Error Example:
Fix:
Check that the named route you are trying to navigate to exists in your app’s route configuration. Ensure that the route name is spelled correctly.
Error Example:
Fix:
Customize the error message to provide more specific information about the issue, and implement the necessary handling or corrective actions.
Error Example:
Fix:
Check if the object is defined before accessing its properties to avoid the error.
Error Example:
When you encounter unhandled exceptions or other runtime issues in your JavaScript code, React Native will display a red box error with details.
Fix:
Review the red box error message to identify the root cause of the issue and then fix the underlying problem in your code. Proper error handling and validation can help prevent these errors.
Error Example:
Fix:
Ensure that the variable or function you are trying to use is declared and in scope. Correct the spelling or make sure the module or function is imported correctly.
Error Example:
Require cycles occur when there’s a circular dependency between modules, leading to issues during bundling. For example, Module A depends on Module B, and Module B depends on Module A.
Fix:
Identify the circular dependency and reorganize your code to break the cycle. Consider restructuring the code to reduce interdependence between modules.
Error Example:
Fix:
Review the code for syntax errors, such as missing semicolons, unmatched parentheses, or incorrect variable assignments. Correct the syntax errors to resolve the issue.
Android debugging is different for local issues and for production issues.
For local android debugging there are multiple ways to debug as discussed earlier. We will deep dive into some of these methods for a step by step instruction on how to debug the android application.
Debugging with logs involves adding log messages to your code to track the flow and values of your application. Here’s a step-by-step guide with an example:
Step 1: Set Up Your Development Environment
Ensure you have Android Studio installed and an emulator or physical Android device connected.
Step 2: Open Your Android Project
Open your Android project in Android Studio.
Step 3: Add Log Messages
In your Java or Kotlin source file, add log messages using the Log class. For example:
Step 4: Run Your App and View Logs
Click the green “Run” button (or press Shift + F10) to run your app.
To view log messages, open the “Logcat” tab at the bottom of Android Studio. You can filter log messages by selecting your app’s package name (in this case, “com.example.myapp”) and the log level (e.g., “Debug” or “Info”).
Debugging with breakpoints allows you to pause the execution of your code and inspect variables. Here’s a step-by-step guide with an example:
Step 1: Set Up Your Development Environment
Ensure you have Android Studio installed and an emulator or physical Android device connected.
Step 2: Open Your Android Project
Open your Android project in Android Studio.
Step 3: Set Breakpoints
In your Java or Kotlin source file, click on the left margin next to the line number where you want to place a breakpoint. A red dot will appear, indicating the breakpoint.
Step 4: Start Debugging
Click the green “Debug” button (or press Shift + F9) to start debugging. Android Studio will launch your app in debug mode.
Step 5: Debug Your App
Your app will run, and when it reaches the line with the breakpoint, it will pause. You can inspect variables, step through the code, and see the call stack in the “Debug” window.
Debugging with ADB allows you to interact with the device and execute debugging commands. Here’s a step-by-step guide with an example:
Step 1: Set Up ADB
Ensure you have Android SDK and ADB installed. You can install it through Android Studio’s SDK Manager or download the SDK separately.
Step 2: Connect Your Device or Emulator
Establish a connection with an actual Android device or initiate an emulator.
Step 3: Launch ADB
Open a command prompt or terminal.
Navigate to the location of the ADB executable.
Step 4: Debug Your App
Use ADB commands to interact with your app. For example, you can view logs using adb logcat:
This will display logs from your app and system logs.
In a production environment, it gets really tough to understand what the user was doing or where the problem occurred as there are limited ways to do so. Crashes are easier to debug with the help of Crashlytics/Firebase. When it comes to finding logical issues or debug customer reported problems it gets really difficult to debug the application unlike in the local environment. Some examples could be application slowing down or data is incorrect or buttons not working or some functionality of the app is not working as expected. Let us take a few examples and find out how to debug production level bugs.
Firebase Crashlytics is the go to tool for almost every Android developer to detect and fix crashes and exceptions. It gives detailed reports and insights into what went wrong. And also integrates with tools like slack for alerting. This helps developers stay on top of any crash or exception in their apps and fix them proactively.
Here’s a step-by-step guide on how Firebase Crashlytics to help detect and debug a crash in a Java-based sample e-commerce mobile application. The crash is simulated in the SIgnUp button click.
Review the Crash Report:
Fix the Issue:
Verify Resolution:
Firebase Crashlytics simplifies the process of detecting and debugging crashes in Android applications. By integrating it into your app and using it to analyze crash reports, you can quickly identify and resolve issues, ensuring a smoother user experience for your mobile application.
Once an error has been reported in production, but is not captured by firebase, one of the common techniques used by mobile developers is to configure and get additional logs to understand the issue. Remote logging configurations can be changed to enable more detailed logs.
Implementing remote debugging configuration in Android involves using a remote configuration service to control various aspects of your app, such as log levels, feature flags, and other settings, without requiring a new app release.
Firebase Remote Config is a popular choice for implementing remote configuration in Android apps. Here’s a step-by-step guide with an example of how to use Firebase Remote Config for remote debugging configuration:
Step 1: Set up Firebase Project
Step 2: Add Firebase Remote Config Dependency
In your app’s build.gradle file, add the Firebase Remote Config dependency:
Sync your project to fetch the new dependency.
Step 3: Initialize Firebase Remote Config
In your app’s code (usually in the onCreate method of your Application class or the main activity), initialize Firebase Remote Config:
java
In the code above, we initialize Firebase Remote Config and set developer mode for faster fetching. In production, you should remove the developer mode settings and set a reasonable fetch interval.
Step 4: Create Remote Config Defaults
Create a resource XML file (e.g., res/xml/remote_config_defaults.xml) to define default values for your remote configuration parameters. For example:
This XML file sets a default value for a parameter named “log_level.”
Step 5: Fetch Remote Config Values
Now, you can fetch remote config values in your app:
In this code, we fetch the “log_level” parameter from Firebase Remote Config and adjust your app’s logging level accordingly.
Step 6: Update Configuration Remotely
You can update the configuration remotely using the Firebase Console. In the Firebase Console, go to Remote Config and add or modify parameters. Make sure your app is fetching the configuration periodically.
This example demonstrates how to use Firebase Remote Config for remote debugging configuration, but you can extend it to control various aspects of your app without the need for app updates.
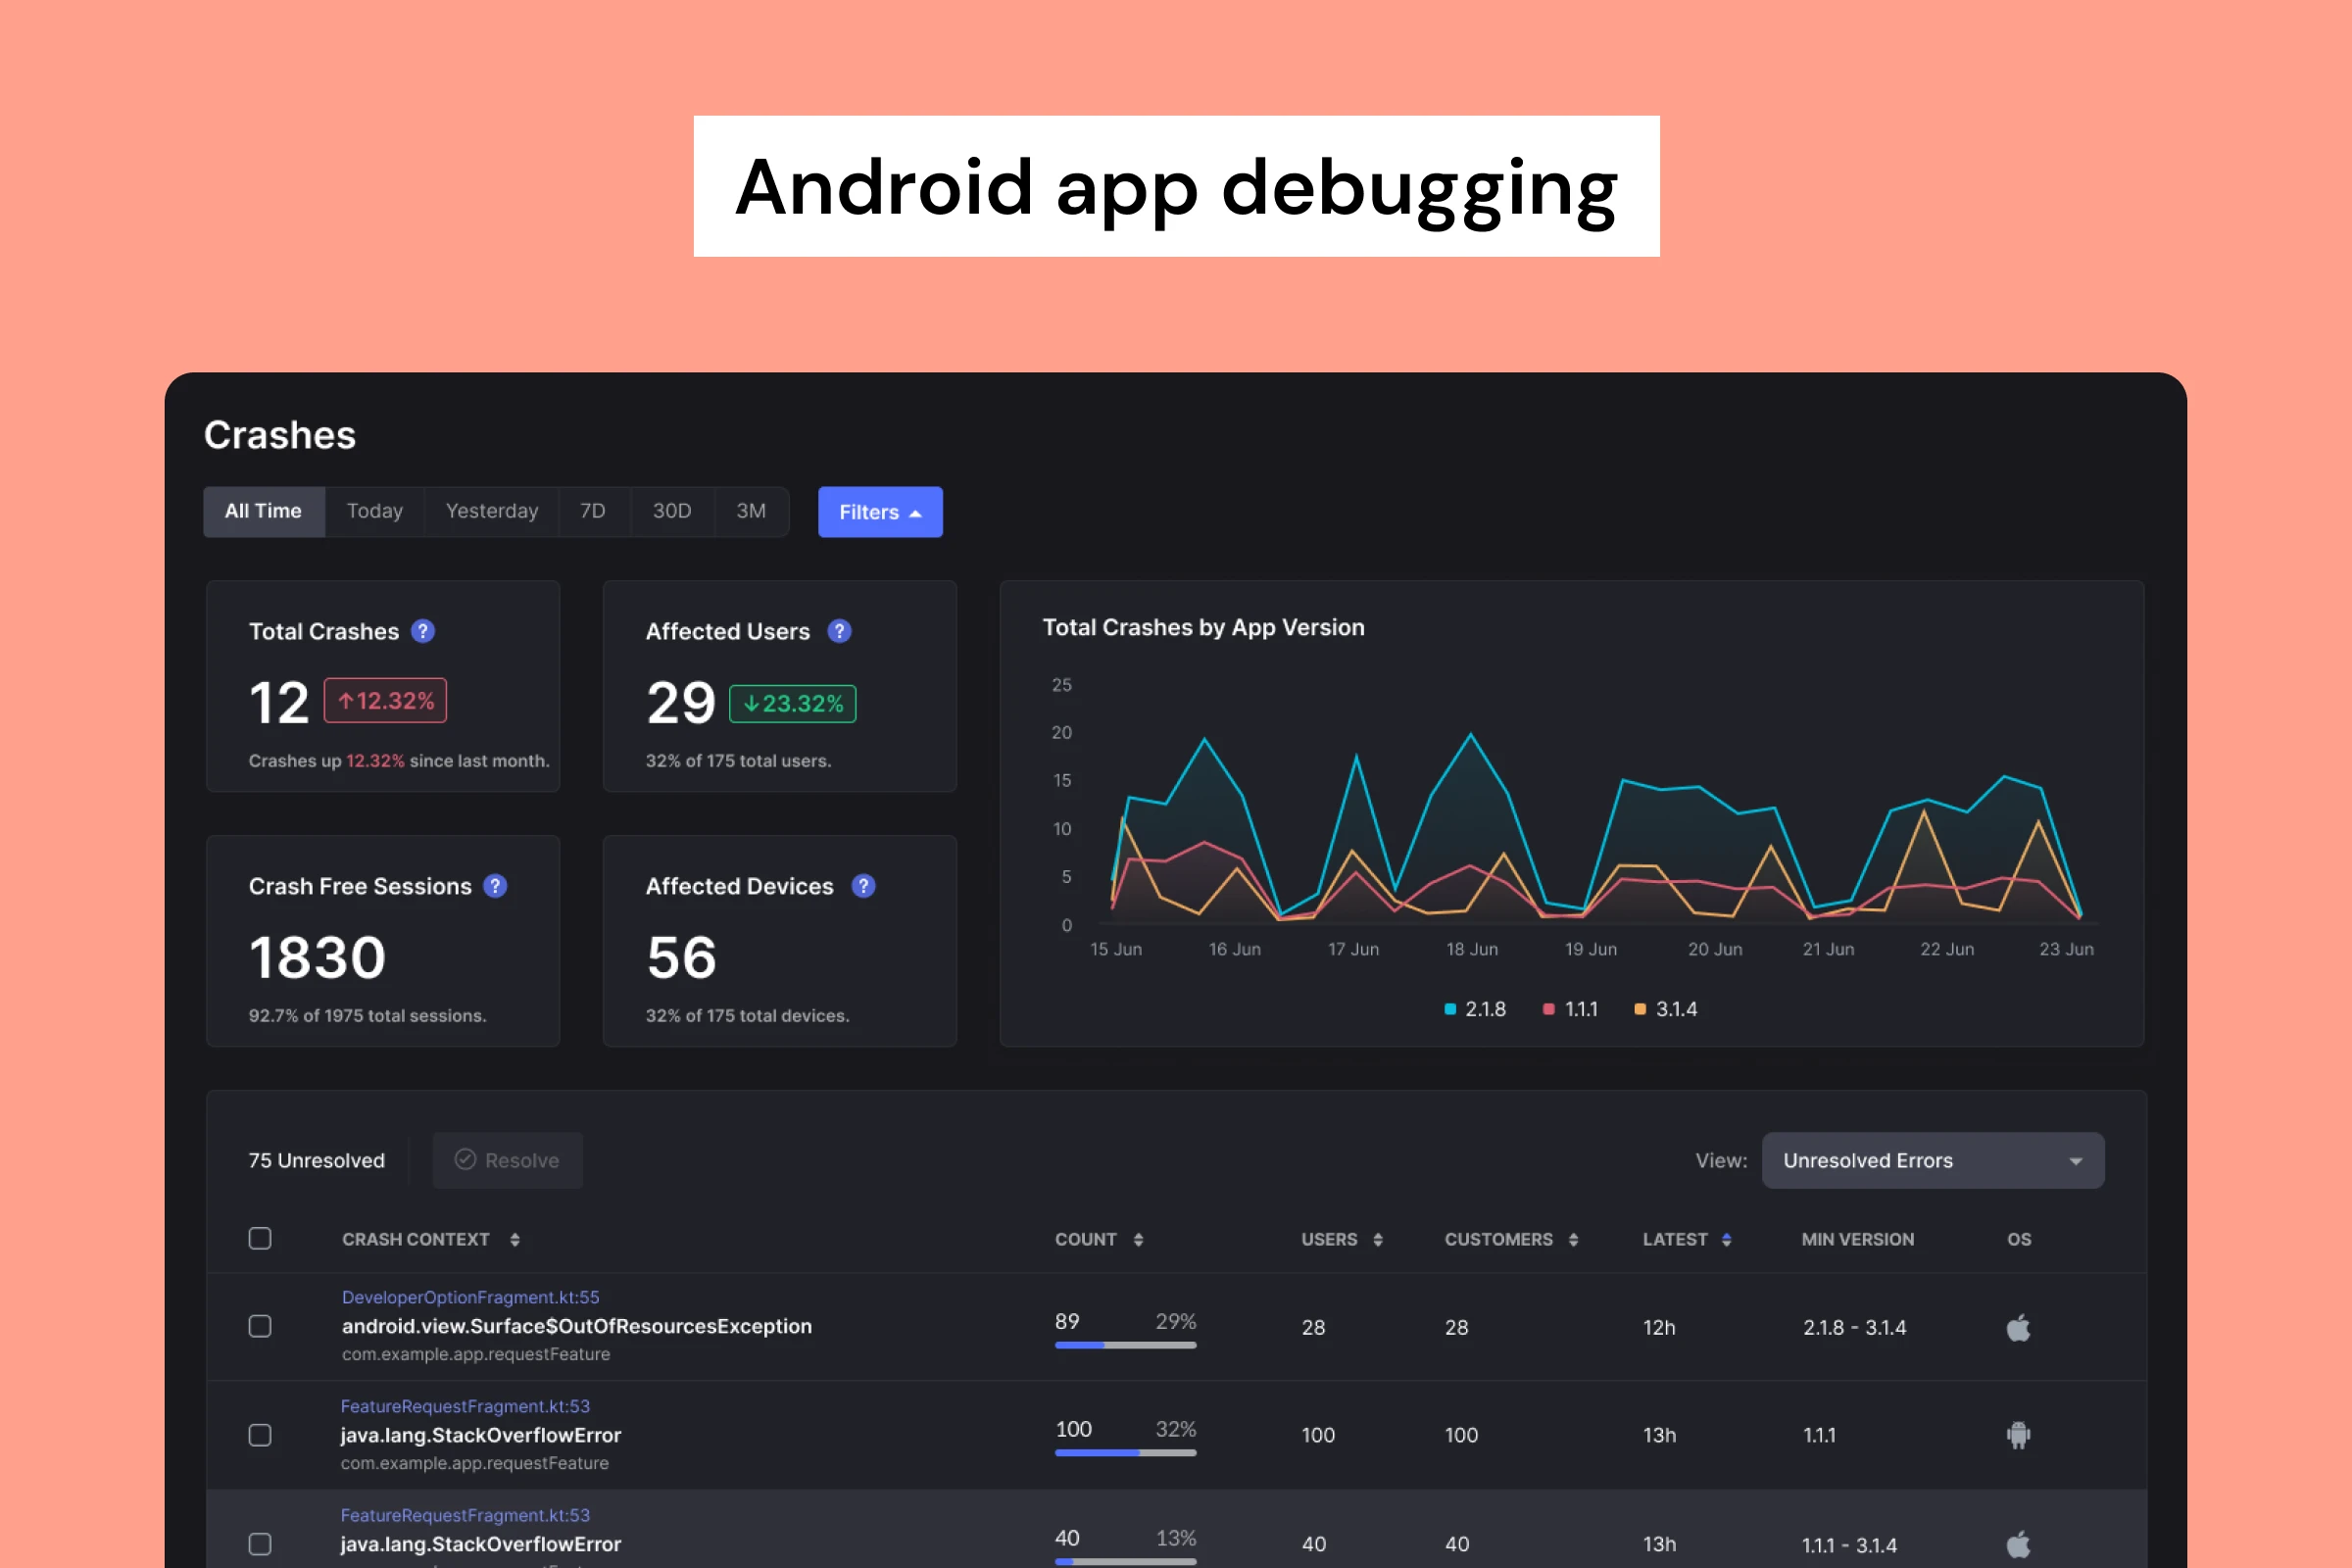
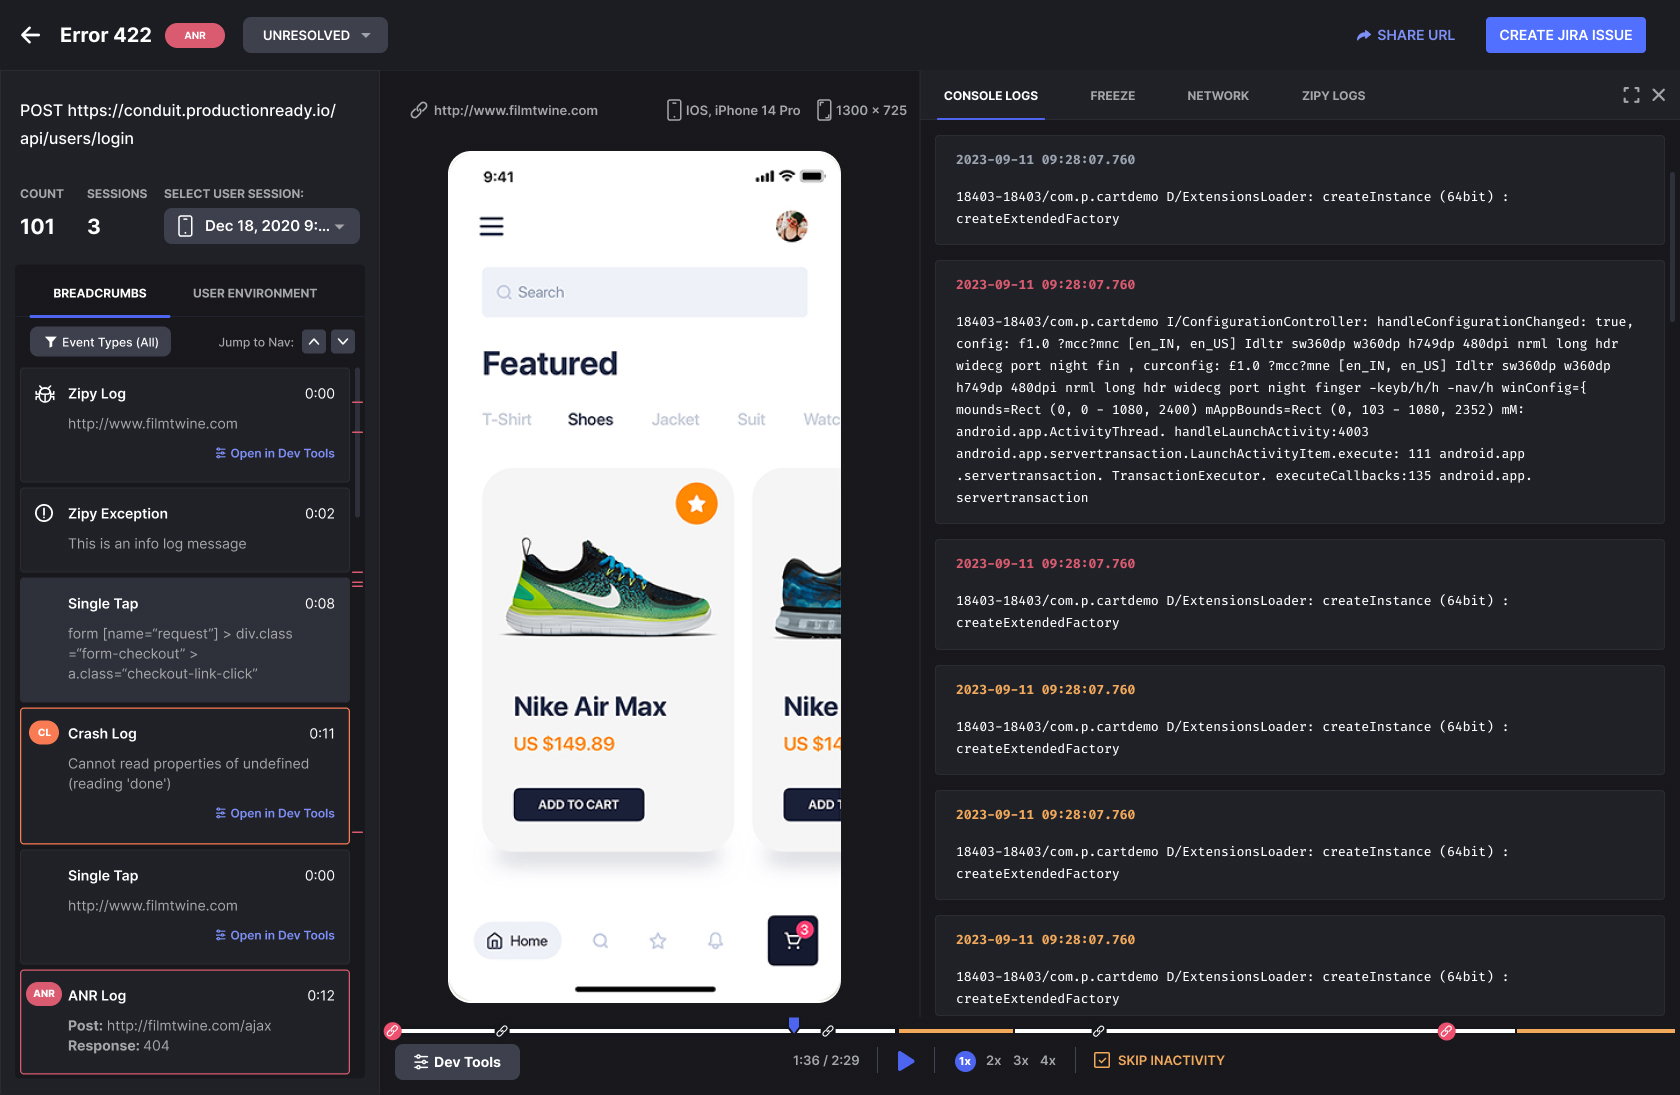
Zipy is an advanced, web and android debugging tool which can help you debug all your production issues live in minutes. Zipy not only captures crash, ANR and exception data but also uncovers many details like clickstream data, network logs, custom logging with various levels, user’s environment details and session recording tool - all in one.
To enable Android SDK in your Java/Kotlin/Flutter/React Native code, check this page or reach out to support@zipy.ai
Here is how Zipy will allow you to capture these details.
Some of the key practices which will ensure quick and efficient android debugging are as follows.
For advanced debugging techniques, there are both inbuilt and third party tools in Android which can be a big help for mobile developers.
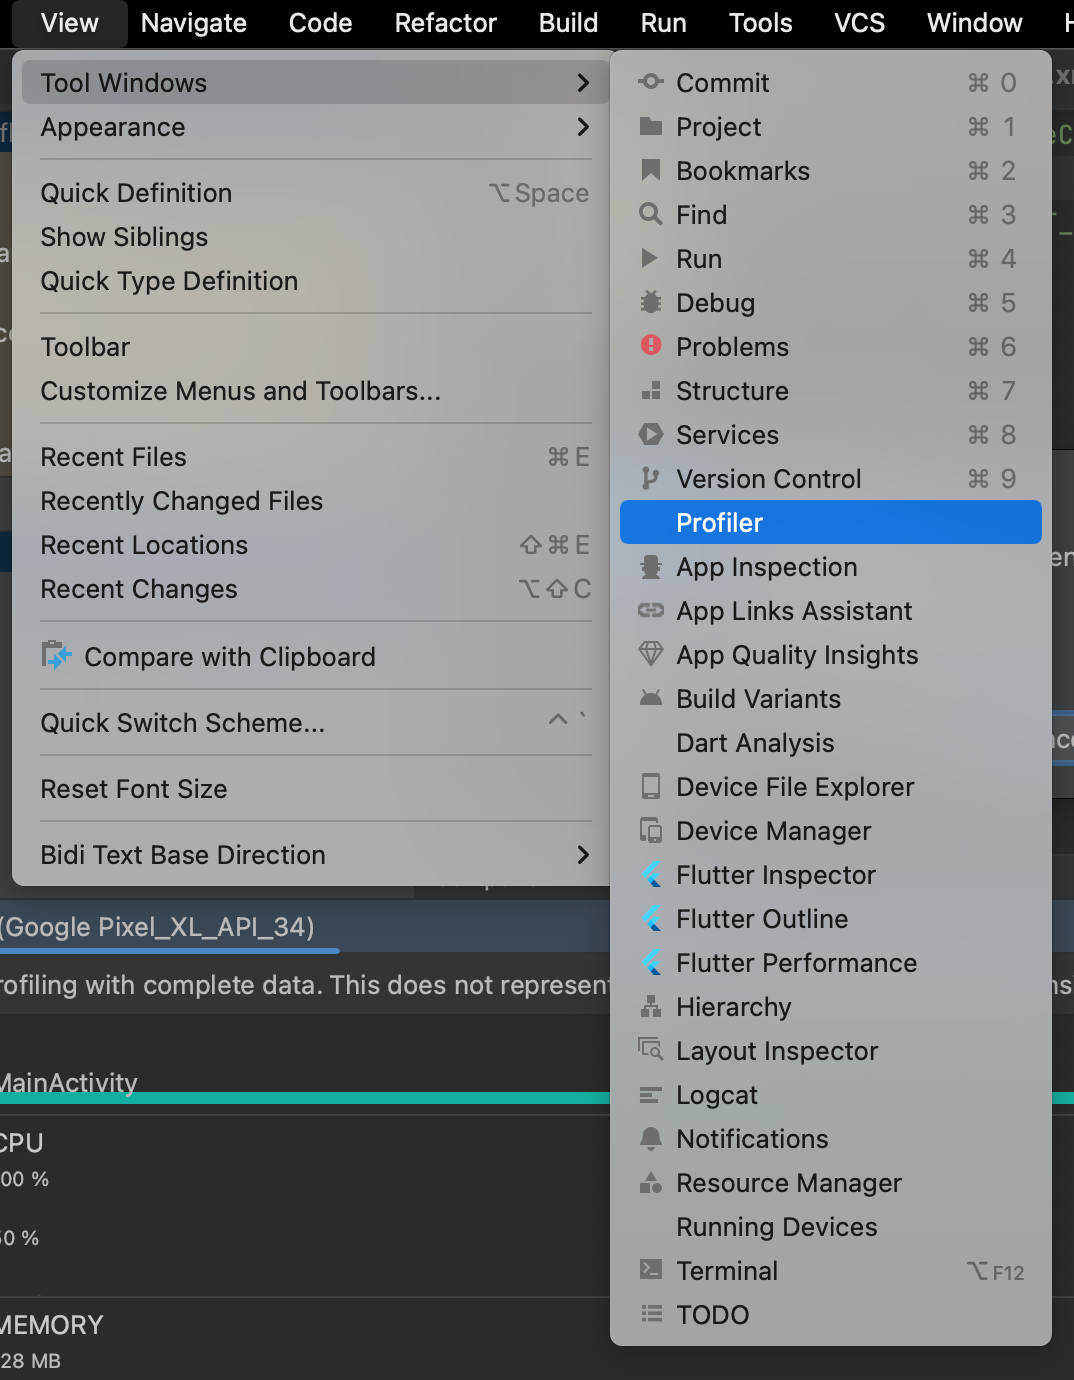
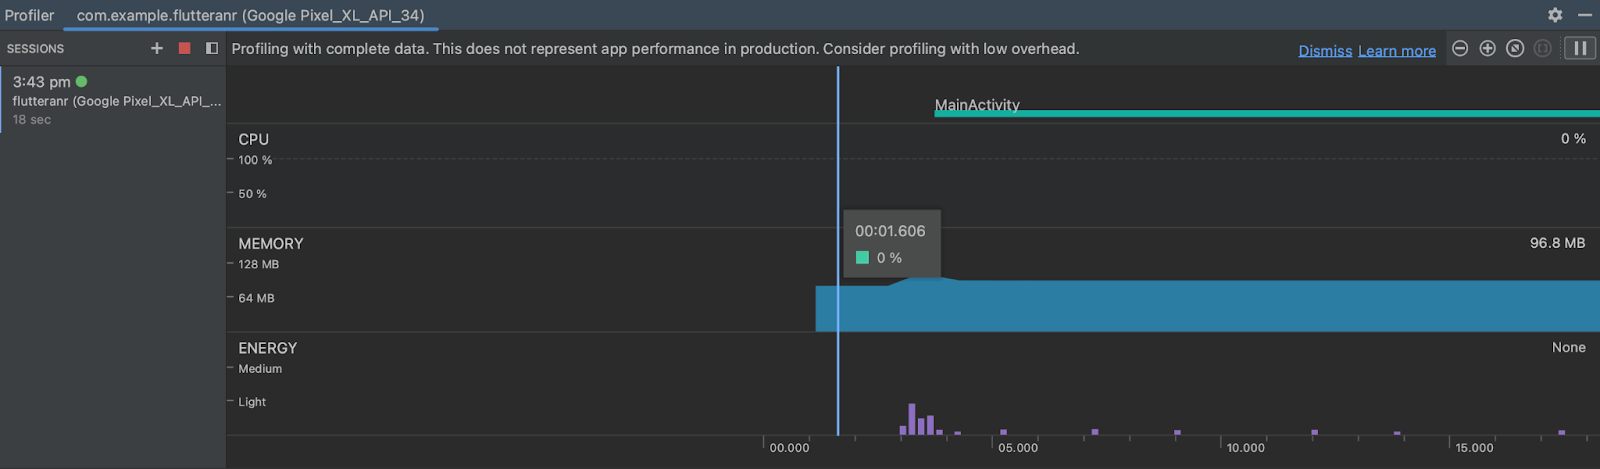
Android profiler:
This tool is integrated into Android Studip and provides real time performance of CPU, network, memory data. Much like devtools in Chrome this helps you debug any performance related problems.
How to start doing Android Profiling for android debugging.
Step1. Open the Profiler
Step 2. Select the device

Step 3. Start Profiling
Systrace:
Systrace gives you system level information like CPU, system events and shows how the application is impacting the system. It is a command-line tool.
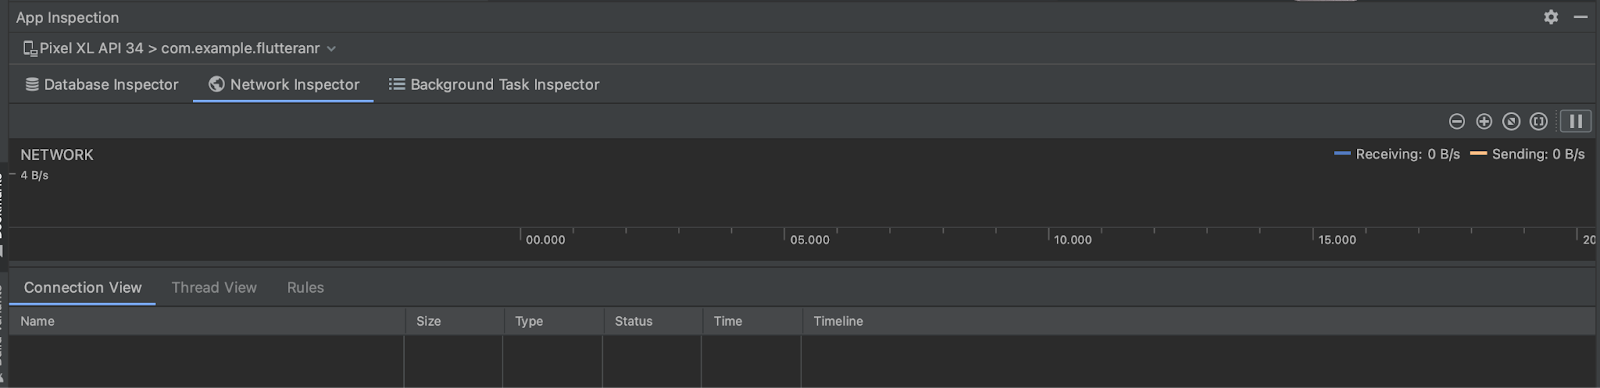
Network profiler:
Network Profiler help you debug android apps by allowing you to monitor all network activity of the application This includes all network request response, payload data.
Memory profiler
Memory profiler helps you analyze memory usage with information on heap allocation , memory allocation racking and allows you to debug memory leaks and understand memory consumption when the app is running.
Zipy helps you debug issues which the customers may be facing in the application. This includes crashes, errors, network problems, logical issues or UX problems. Zipy helps in debugging with the following features it provides on the platform.
.jpg)
As of 2023, Android captures the market by 69.44% and a lot of effort will go in evolving the OS further. As a result of which Android debugging will remain relevant and will need advancements in technology and tools. Here are some trends and developments that are likely to shape the future of Android debugging:
Enhanced profiling and tracing tools:
Android Studio and third-party tools will continue to improve their profiling and tracing capabilities. This includes more detailed and real-time insights into CPU, memory, network, and GPU performance.
Machine learning-powered debugging:
Machine learning and AI will be used to help in identifying and suggesting solutions for common Android issues, making debugging more efficient.
Cloud-based debugging and monitoring:
Cloud-based debugging and monitoring solutions will become more prevalent, allowing developers to gather and analyze performance data from real-world user scenarios.
Remote debugging and collaboration:
Remote debugging tools will enable developers to debug Android apps on physical devices located in different geographical locations, facilitating collaboration and issue resolution.
Continuous integration and continuous debugging:
Debugging will be seamlessly integrated into the continuous integration and continuous delivery (CI/CD) pipeline, allowing for automated testing and debugging of app releases.
Optimized gebugging workflows:
Improved tooling and workflows will streamline the debugging process, reducing the time required to identify and fix issues.
Cross-platform debugging:
With the growth of cross-platform development frameworks like Flutter and React Native, debugging tools will need to adapt to provide seamless debugging experiences across multiple platforms.
Enhanced security debugging:
As security becomes an even more critical concern, debugging tools will incorporate features to identify and resolve security vulnerabilities in Android applications.
Real-time monitoring and alerts:
Debugging tools will provide real-time monitoring and alerting capabilities to detect and address performance issues as they occur in production environments.
Augmented and virtual reality debugging:
As AR and VR applications become more prevalent, debugging tools will need to adapt to cater to the unique challenges of these immersive experiences.
Privacy-focused debugging:
Privacy regulations and concerns will lead to debugging tools that can help developers ensure the security and privacy of user data in Android apps.
Community and open-source debugging solutions:
Open-source debugging tools and community-driven resources will continue to play a significant role in the Android debugging ecosystem.
The future of Android debugging will likely be shaped by a combination of technological advancements and the evolving needs of Android developers. Debugging will remain a critical part of the app development process, and as the Android ecosystem grows and becomes more diverse, debugging tools and practices will adapt to meet the challenges of the ever-changing landscape.
From 2008 to 2023, Android has come a long way in terms of the OS growth, applications built and total number of devices which run on Android today. From Java apps to Kotlin to react native and flutter apps, the frameworks and languages have also evolved significantly. The tools which help to debug Android applications have also developed — quite a few being supported in the Android development environments and many third party applications which help in advance debugging in production environments.
While Android Profiler, ADB, Firebase, Instabug, Bigsnag are all great examples of android debugging platforms, there are still many gaps in detecting and solving production bugs. One of the primary reasons is that the customer base of Android applications is huge and there are thousands of device and OS combinations that exist. Most of the Android App debugging is reactive.
We need more advanced tooling, powered with AI, to proactively solve for Android applications as these frameworks and devices continue to grow with the increase in Android adoption. Zipy is one such platform which will help you debug your production issues proactively, quickly and smartly. For more information,try Zipy Android SDK.
Feel free to comment or write to us in case you have any further questions at support@zipy.ai. We would be happy to help you. In case you want to explore for your app, you can sign up or book a demo.
If you have any more questions feel free to reach out to us at support@zipy.ai.
.svg)
Android debugging on a phone implies finding and solving issues in Android applications running on the phone. This includes tracking and fixing crashes, ANR’s, errors, UX issues, system problems. Debugging is done to help stabilize the android application and improve user experience.
In Android development, there are several effective debugging techniques that developers can employ. One common method is Logcat Logging, which involves using the Android Log class to insert log messages within the code. This approach helps in monitoring the app's behavior and inspecting the values of various variables. Another crucial technique is Breakpoint Debugging, where developers place breakpoints in the code. These breakpoints halt the execution at designated points, enabling the inspection of variables and the evaluation of expressions in real-time. Additionally, the Android Profiler, an integral part of Android Studio, offers real-time performance monitoring. It tracks metrics such as CPU, memory, network, and GPU usage, providing a comprehensive view of the application's performance. Systrace is also a valuable tool, capturing system-level performance events. This tool is instrumental in analyzing CPU, GPU, and I/O activity, offering insights into the deeper layers of system performance. Remote Debugging is another technique, allowing developers to debug an Android app on a physical device or emulator from a separate machine. Lastly, ADB (Android Debug Bridge) is a versatile command-line tool used for interacting with an Android device or emulator. It is a fundamental part of the Android development toolkit for debugging and testing applications.
Debugging in Android can be approached in various ways, either through Android Studio or by using third-party libraries. For local debugging of an Android app, the process begins with setting up the development environment in Android Studio, along with a connected device or emulator. Once the Android project is opened in Android Studio, developers can add log messages using the Log class or set breakpoints at crucial points in the code. Running the app in debug mode then allows for the use of Android Studio's debugging tools to inspect variables and step through code meticulously. Additionally, analyzing the logcat output is a key step in understanding and debugging the app's behavior. This systematic approach aids in identifying and rectifying issues within the app's code.For Android applications in production, the debugging steps involve different methodologies. One effective approach is to instrument the code with a third-party tool like Zipy, which facilitates detailed monitoring and troubleshooting. Integration with communication platforms such as Slack is also common, enabling teams to subscribe to production alerts. This integration allows for efficient debugging based on slack alerts or proactive logging into Zipy to debug mobile app sessions and errors. These methods provide a more comprehensive and reactive approach to debugging, especially crucial for apps already in production.
Debugging Android React Native apps would also be similar to the Android apps. For local debugging one can use logging and breakpoints in Android Studio. For debugging production level bugs, one can try third party tools like Zipy.
Zipy provides you with full customer visibility without multiple back and forths between Customers, Customer Support and your Engineering teams.
The unified digital experience platform to drive growth with Product Analytics, Error Tracking, and Session Replay in one.


.webp)